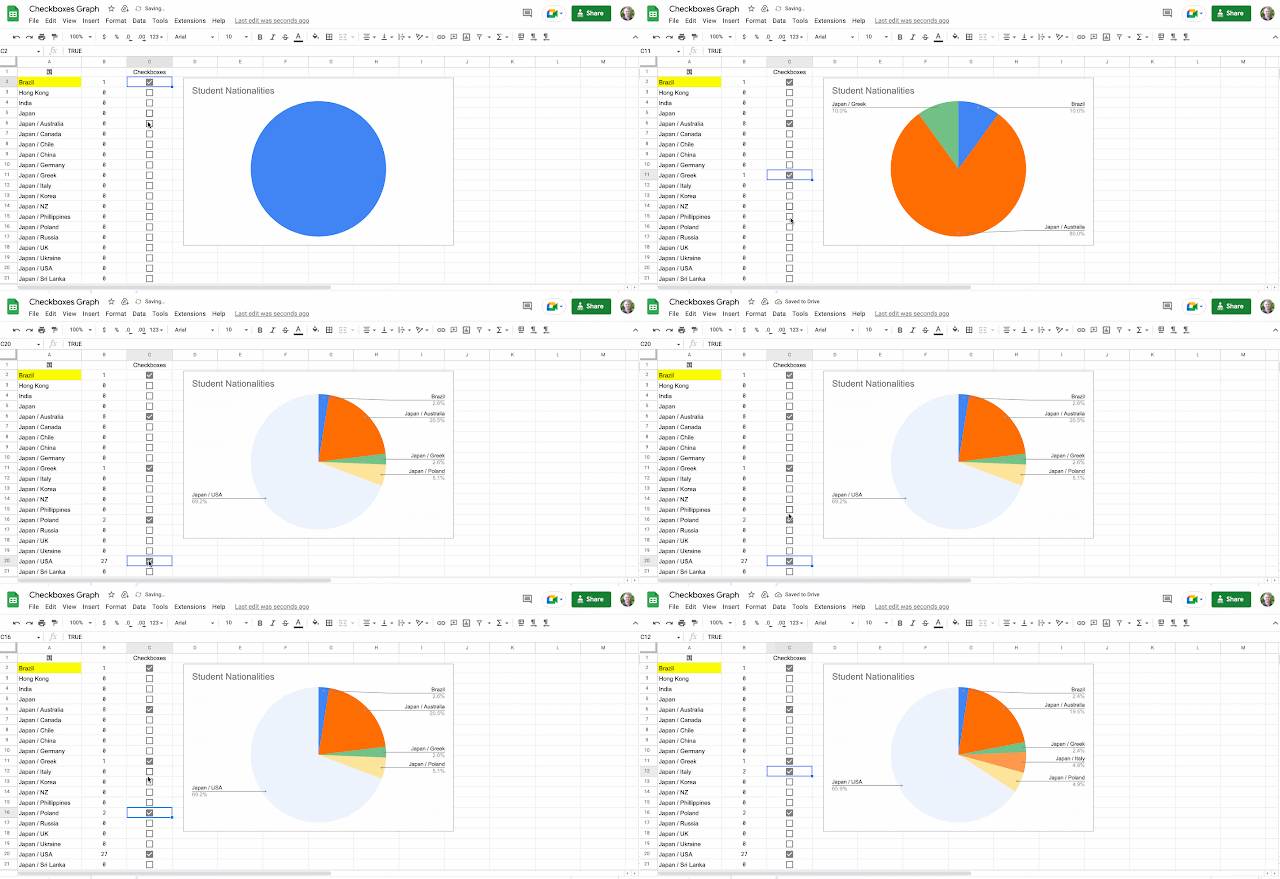
Interactive Chart Data with Checkboxes

Data is most useful when it can be manipulated easily, by anyone. To help our admissions officer, I made a checklist of countries where our current students have come from. I made this last school year, so I am trying to reconstruct this. I must have started by taking the student data and putting it on the first sheet. Again, I am just guessing, but that seems like a reasonable place to start. Then, I am pretty sure I followed that by starting building the formulas on the second sheet. I made three columns, a country name, number of students for that country, and then the checkbox. The formula I used was a SUMIFS formula = IF ( C2 , SUMIFS ( Sheet1!$B27:$B51 , Sheet1!$C27:$C51 , A2 ) , 0 ) This formula made it so that the student population would show up only when the box was checked. I then made a chart from the column with the number of students. That way when the numbers changed, the chart also changed in real time. I would like to make it so that when you are looking at the cha