Friday, April 25, 2025

SUBTOTAL

While looking at my YouTube feed, I saw a video with an interesting title - The Excel Function You Didn't Know You Needed. Then the subtitle said that there were 11 or so functions embedded within it. 

The most useful parts of the function that I think will be more useful are the 7 listed below - 

1 AVERAGE
2 COUNT
3 COUNTA
4 MAX
5 MIN
6 PRODUCT
7 SUM


Spreadsheet

YouTube Video

Sunday, March 2, 2025

Most Voters Have Heard Nothing at All About Carbon Removal

This was an interesting graph I found on Data for Progress, and when I find an interesting graph, I try to remake it in Google Sheets.


This was a hard one, and the closest I could get was the graph below. Looking at it again, though, I also forgot to remove some of the lines.


A little refining 


(Made with Datawrapper) -- And I still couldn't match it.

Saturday, March 1, 2025

Working with PE Data

In MYP, Math classes and the PE class worked together to make an IDU. They took data from some drills and health tests and put them in a table. 
-- we should start thinking more about how we plan these units and how we can get more teachers working together --


I am scheduled weekly to be with the math class, but when I was in the class, I was suddenly asked to help some students make a graph. 

I wish I had been able to be more a part of this unit. I could have shown teachers and students how to structure the data they were using to make it easier to make a graph. 

Sunday, February 23, 2025

Creating Vertical Lists with Checkboxes

 =TEXTJOIN(CHAR(10), TRUE, FILTER(B4:B5, C4:C5=TRUE))

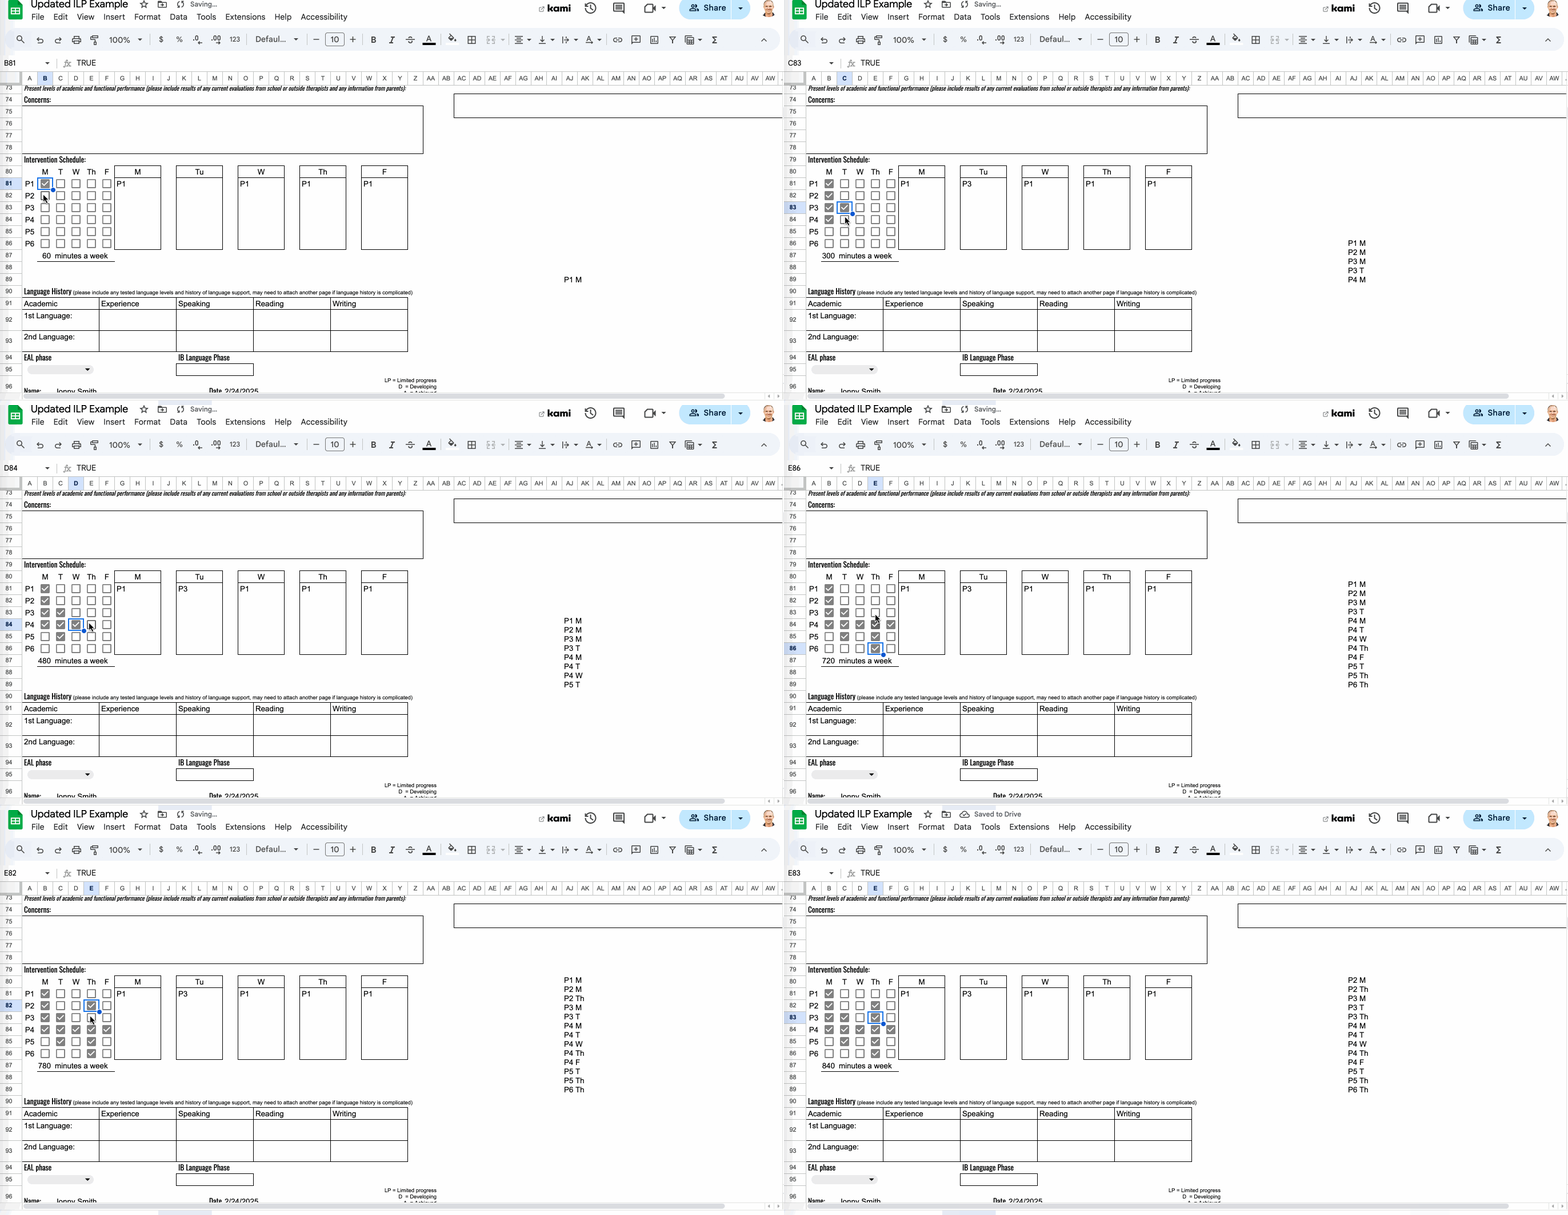
Today, I realized you can use a formula to make a list inside a cell in Google Sheets. 

Why would you want to do this?

In my case,  I am trying to make the IEP/ILP process smoother. It doesn't make sense to keep rewriting information each time you write a report about a student. I think using a Google Sheet to make a document will be easier. 

I was able to put text together using TEXTJOIN and separated by a space or by comma before, but ChatGPT showed me that I could add the CHAR(10) -- line break -- to a formula to make the list.

This formula puts checkmarks in a list, in order of day, combined with the labels from the matrix.


Save this formula for later. 
=TEXTJOIN(CHAR(10), TRUE, ARRAYFORMULA(IF(B81:F86, A81:A86 & " " & B80:F80,)))

I ended up separating them out into the columns to the right of the checkboxes.

Wednesday, February 12, 2025

Challenge Accepted

A few weeks ago, maybe a few months now, I created a schedule using ClaudeAI to make a testing clock. 

Screenshot of a testing accommodations tool made with ClaudeAI

It's functional. It works. 

Today I noticed that my colleague, who also does testing accommodations, had a spreadsheet projected on the whiteboard with the times.


When he projects it on the whiteboard, it looks like this:


I asked about the formulas in it. At the time, he didn't have any. 

My mind immediately went to work about how to make it work in Google Sheets. 

I had the basic structure in my mind. During my break I went to work building it. 

When we give accommodations, we write the start time, 30 minutes remaining, 5 minutes remaining, and the end time. Calculating this is always a chore. 

To the spreadsheet! 

I knew I wanted a drop-down of student names. This would eventually be for all students in inclusion support, so it would be quick and easy to use.

I found online that I could use a formula called =TIME. Using ChatGPT, I was able to do a VLOOKUP with all the names that looks like this - =B4+TIME(0,B3,0)+TIME(0,B8,0)

Here are all my formulas for this one.
=B7-TIME(0,5,0)
=B7-TIME(0,30,0)
=B4+TIME(0,B3,0)+TIME(0,B8,0)
=B3 + (B3 * IFERROR(VLOOKUP(B1, E4:F7, 2, FALSE), 0))


My tool


Here's a link to the working example.

I'll start making it look better tomorrow. I also have to check my formulas.

Thursday, November 28, 2024

SEQUENCE

The SEQUENCE formula will do what is says - it will make a sequence of numbers in many different ways. Here is a video I made that demonstrates it.


Saturday, November 2, 2024

TOCOL and TOROW

TOCOL and TOROW

There are two functions to look at when changing a dataset into a column or row: TOCOL and TOROW. Both of these formulas take an entire dataset and reformat them to either a column or a row. 

In the example below, I have a dataset surrounded by a black line. To make it into a column, in the cell A2 I typed the formula =TOCOL(C8:O70). C8:O70 is the range of the data. 

When I tried TOROW, I had to add another 500 columns, so I just adjusted the range so it would fit.